
Those estimates have the fretful psephologists, such as Politico's Andrew Howard, fretting.
Democrats could face a gloomy Electoral College atmosphere next decade, according to new population estimates released Tuesday that show red-leaning states like Texas and Florida making major gains and California as a big loser.Such maps presume no change in the size of the House of Representatives and no change to state allocations of electoral votes. Such tweaks are less important than the change in regional balances of power.
By combining the census bureau’s new state population estimates for 2025 with previous years’ data, experts quickly projected the number of House seats — and Electoral College votes — states will gain or lose after the 2030 Census in the process known as reapportionment. And while those projections differ slightly, they all had bad news for Democrats: GOP-leaning states will gain electoral power and Democratic-leaning states will lose it if the trends continue.
The change in regional balances of power reflects changes in the relative populations of the several states. Mr Li develops that story.
In recent years, as the native-born U.S. population has become older, immigration rather than population increase from births become an increasingly big component of U.S. population growth, in both blue and red states.With the border closed since January 2025 to illegal immigration and the legal immigration bureaucracy continuing to proceed at the pace of process, internal migration will matter more. Mr Li notes that a shutdown of the border along with deportations, voluntary or otherwise, can affect the 2023 census.
In fast-expanding Texas, for example, immigration accounted for 44 percent of the Lone Star State’s population growth between 2024 and 2025, a larger share than came from either domestic in-migration or natural increase (births).
Similarly, in the same period, immigration accounted for more than 90 percent of Florida’s growth. While Florida added 178,674 immigrants from outside the United States to its population between 2024 and 2025, only 22,517 people (barely a tenth of the state’s new immigrant population) moved there from other parts of the United States last year. (As a state with a significant population of retirees, Florida has long had more deaths than births each year.)
California, Illinois, and New York, likewise, all would have seen a net loss in population during the period had it not been for immigration.
The role of immigration as a driver of population growth was especially pronounced during the first three years of the Biden presidency when the clearing of pandemic-era visa backlogs and a spike in the number of people seeking admission to the country on humanitarian grounds (i.e., seeking entry as refugees or applicants for asylum) helped to offset a nearly two-decade decline in births and an increase in deaths among the giant but aging cohort of Baby Boomers.
For example, with zero immigration between 2025 and 2030, the Brennan Center projects that Florida would gain only two seats rather than three because it would go from being one of the nation’s fastest growing states to a relatively slow growing one. Meanwhile, Wisconsin would keep a seat that it is currently projected to lose.It is to the level of internal migration that we next turn. Our second map comes from Jonathan Lansner's "Forget California’s exodus. Why do so few move here?" in Orange County's Register. In the original article, it, too, is an interactive map, and I did another screen capture.
And importantly, reduced levels of immigration mean not just fewer people arriving in the United States each year, but fewer births since immigrants tend to be younger in general than native-born Americans.

His point is a simple one, there's not much flight from any one state, and California is not losing population.
Let me say for the umpteenth time, there is no California exodus.He concludes his column with a call for a third map.
The Golden State’s popularity among its own residents is among the nation’s highest, as measured by the small share of residents who depart for other parts of the country.
Its stagnant population challenge is really about the stunningly few Americans who relocate to California.
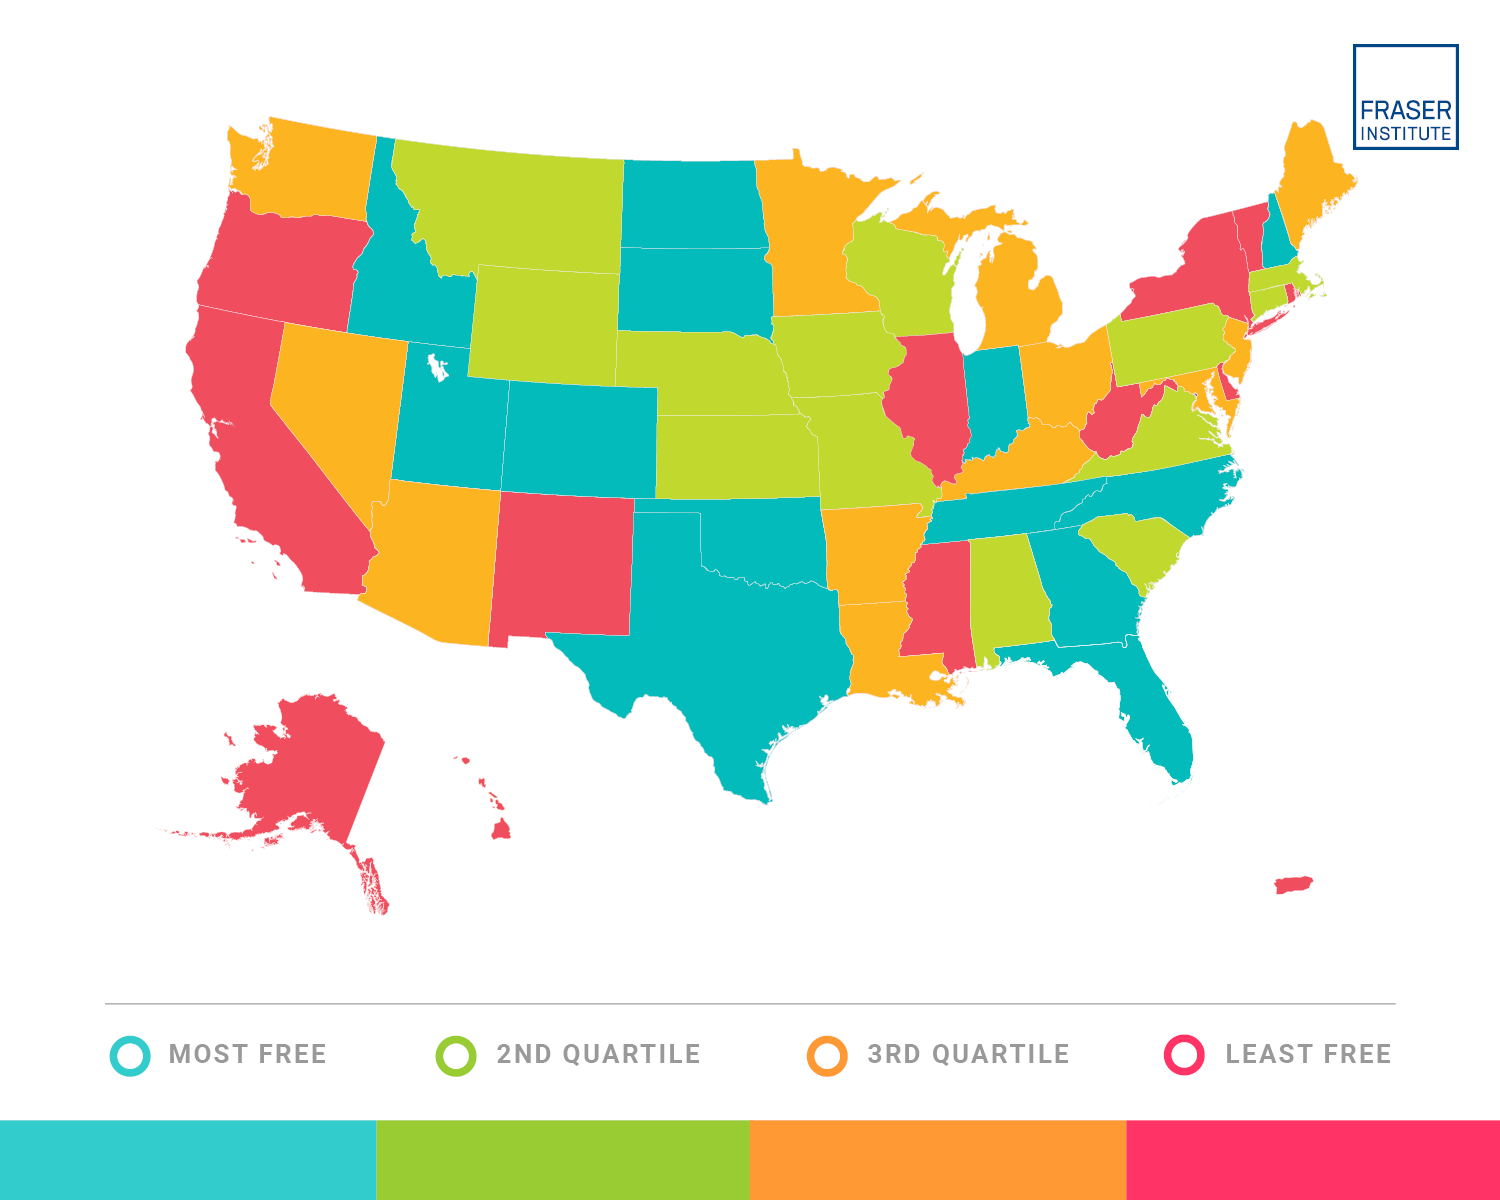
Swings in population totals are more than bragging rights. They can alter everything from economic opportunities to housing costs to traffic patterns to government needs to politics.The third map comes from the Fraser Institute's Economic Freedom of North America report.
If California truly wants to grow – but I think most residents seem fine with the status quo – forget the “exodus” chatter.
Someone should start talking about improving the state’s horrible inability to attract fellow Americans.

Fraser Institute map retrieved from The Daily Economy.
In The Daily Economy, Matthew Mitchell and Vance Ginn argue, "For decades, states that limit government growth, keep taxes low and predictable, and allow labor markets to adjust have outperformed their peers on jobs, incomes, and growth. This is not fashionable economics. It doesn’t promise quick fixes or dramatic announcements. It just works."
There are subtleties to the Fraser index, and note how Mississippi and Alaska join California and Illinois in the "least free" quartile.
These data reinforce the intuition that people move away from high costs and low flexibility. A common objection is that these rankings are backward-looking. That’s true — and that’s the point. Institutions don’t change outcomes instantly. The index reflects what policies actually produced, not what politicians promise next. Using 2023 data filters out press releases and captures lived reality.Internal migration, and shifting voting patterns, might not be the "red state boom and blue state depression" Red State's Nick Arama hails, let alone the flight from bad governance Town Hall's Guy Benson cheers. "These shifts are a direct result of bad governance in blue states and cities. Right/leaners and normies aren’t melting down and forming militia style mobs to harass and stalk leftist leaders. They’re just leaving."
Over time, the pattern is unmistakable. States that protect economic freedom experience higher incomes, stronger employment, greater mobility, and more resilience. Those states that erode it experience the opposite — usually with a lag that makes denial tempting.
From a classical-liberal perspective, none of this should be surprising. Economic freedom respects individual choice, local knowledge, and voluntary exchange. The fact that it also delivers better outcomes is not an accident. It is the market mechanism at work.
The political economy lesson is simple but uncomfortable: prosperity doesn’t come from doing more. It comes from consistently getting out of the way. Spending restraint, simple taxes, and flexible labor markets are not exciting. But they are effective.
The data keep saying the same thing. The states keep proving it. Economic freedom still wins — even when politics pretends otherwise.
There's definitely room for additional research, perhaps conducted, if that is still possible, in a dispassionate way. Note, for instance, how Mississippi rates among the least free and not losing seats, while Tennessee rates among the most free and not gaining seats. What is a parsimonious set of explanatory variables to capture internal migration?
As long as I'm asking for so much, might I also ask for the networks to go back to alternating the colors in presidential elections, so that sometimes the states carried by Republicans get colored in blue?




No comments:
Post a Comment